


Will The U.S. Budget, Budge? – The History and Future of the Federal Deficit
Andrea Taylor, CPA, MSA Wealth Management Advisor | Aubrey Brown, CFP®, EA, M.S. Wealth Management Advisor | April 24, 2025
For many investors, the federal deficit represents an intangible,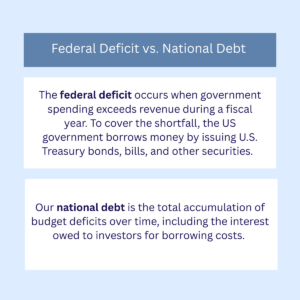 distant issue that reflects more about Washington politics than personal finance. As wealth managers, we know the size and trajectory of the U.S. deficit can influence market conditions, interest rates, and ultimately our client’s long-term financial plans. As we help clients plan for retirement, manage portfolios, and consider estate or tax strategies- it’s important to understand how macroeconomic factors, like the deficit, shape our environment.
I. The Federal Deficit Over Time
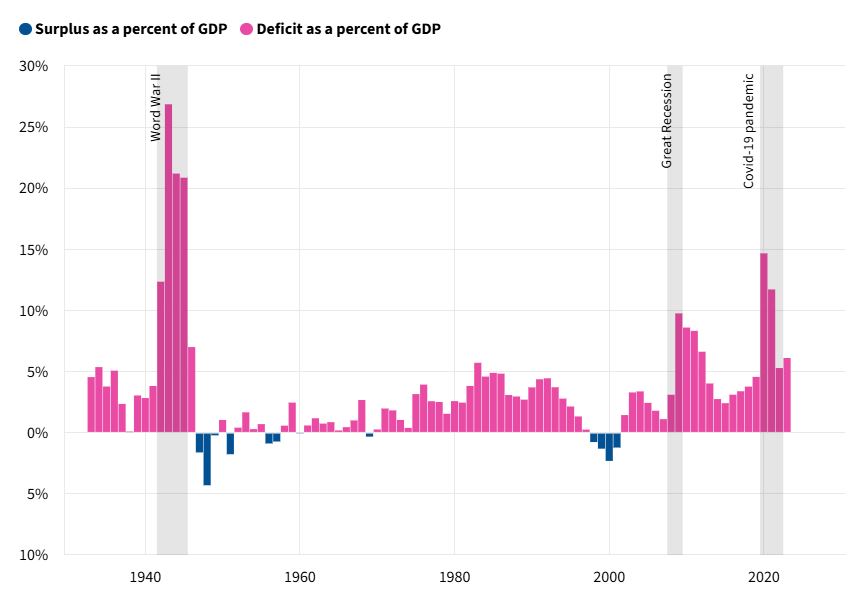
One way to understand the federal deficit is by comparing it to our GDP, which is the overall size of the U.S. economy. Expressing the deficit as a percentage of GDP accounts for inflation and allows for more meaningful comparisons year over year. Since World War II, the deficit has moved in cycles with notable surges during wartime spending and recessionary periods. Historically, deficits widen during recessions and narrow during periods of economic growth.
Notable moments in U.S. budget history began with World War II, which triggered the largest federal deficit on record as a percentage of GDP. In 1943, the deficit totaled $55 billion, or 26.9% of GDP, as the government financed massive military spending through war bonds and increased income taxes.
The Great Recession of 2008 caused the deficit to balloon to $1.4 Trillion in 2009 (9.8% of GDP) due to stimulus spending, bailouts, and falling tax revenues. Although costly, the stimulus efforts are credited with stabilizing the economy and preventing a deeper recession.
Most recently, the COVID-19 Pandemic of 2020 saw the second-largest deficit in US History, behind WWII on a percentage of GDP basis. The deficit reached $3.1 Trillion (14.7% of GDP) in 2020. Significantly increased government spending included enhanced unemployment benefits, direct payments to individuals, and Paycheck Protection Program (PPP) loans.

Exploring 2023 Further
Recently, we have seen a reversal of the historical patterns explored above. In 2023, despite a growing economy and relative peacetime, the U.S. deficit reached approximately 6.1% of GDP- a significant shortfall by historical standards.
Deficits are driven by two main components: a decline in federal revenue and an increase in government spending. Federal revenue dropped sharply in 2023, primarily due to a decrease in capital gains tax collections following the stock market downturn in 2022. On the other side of the equation, federal spending rose substantially. A large portion of this spending falls under non-discretionary programs (such as Social Security, Medicare, veterans’ benefits, and unemployment insurance) which will continue to grow as our population ages and healthcare costs rise.
To better understand this dynamic, the two charts below illustrate the trends in federal revenue and expenditures from 2019 to 2024, highlighting the widening gap between what the government collects and what it spends. 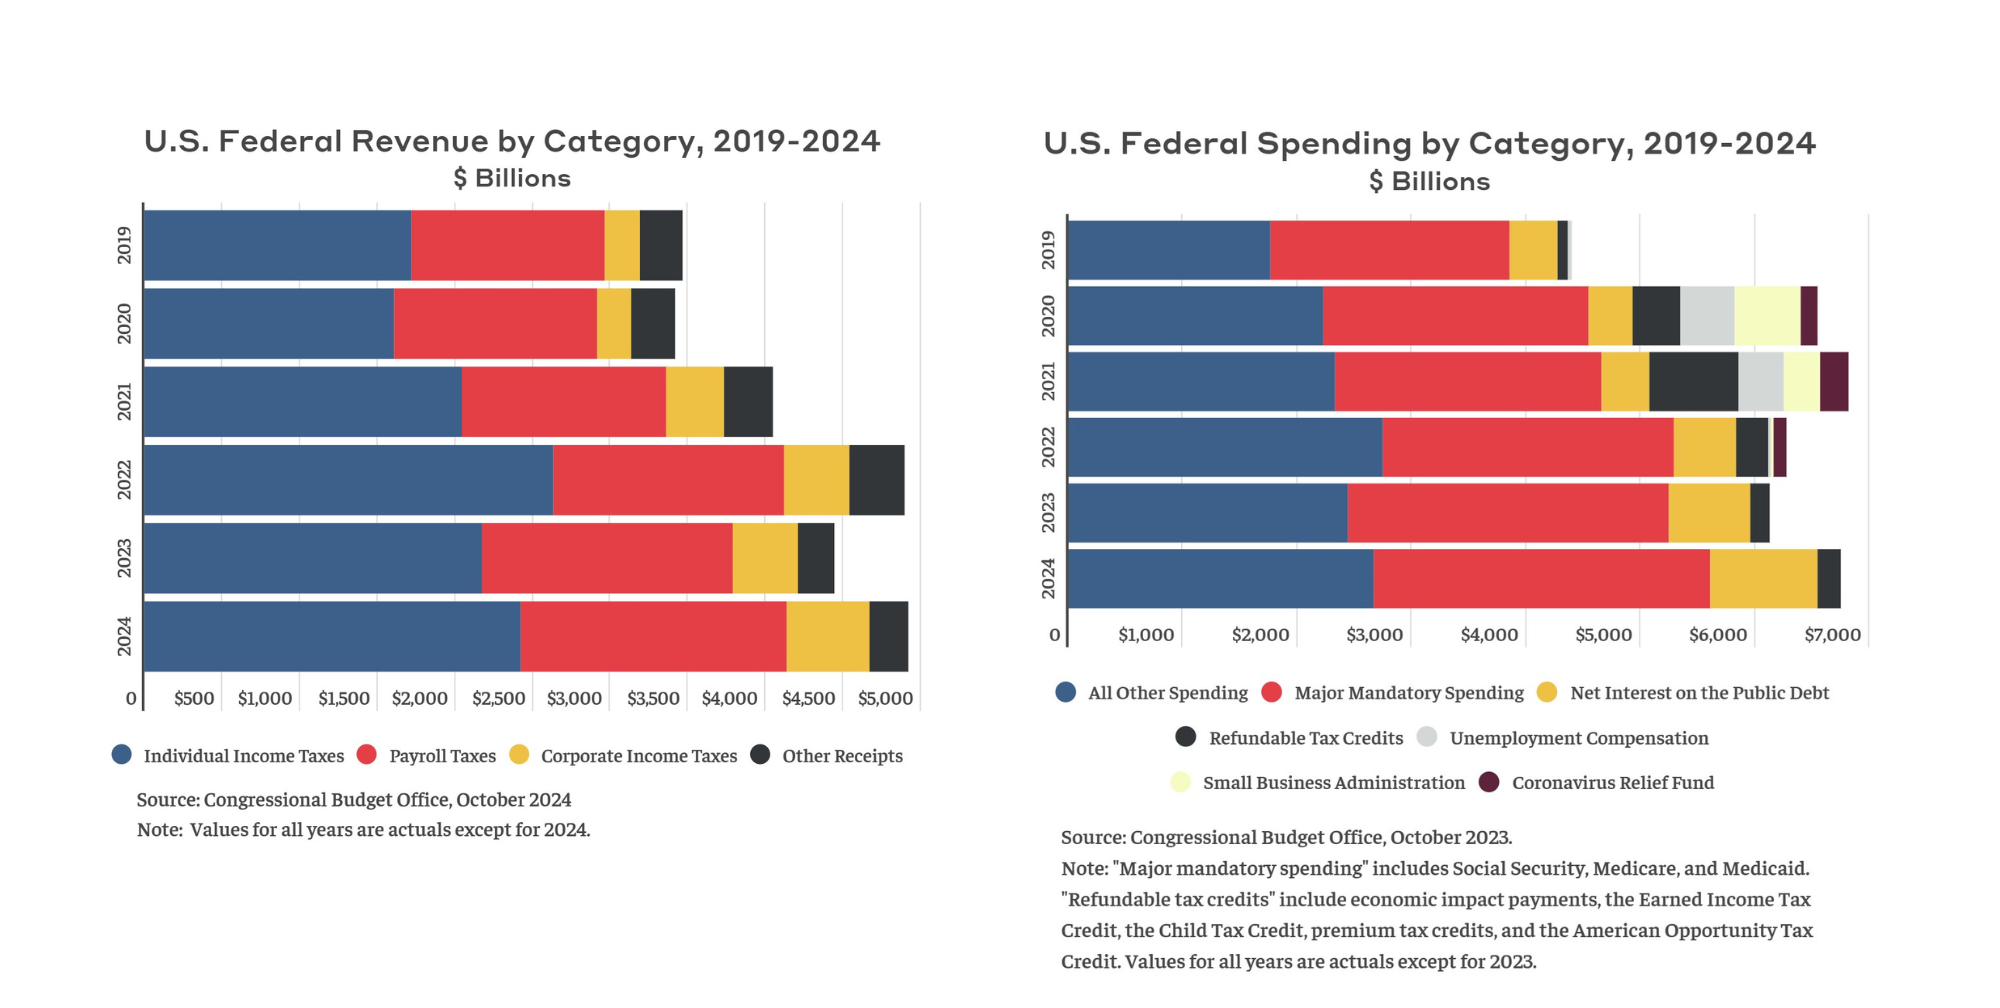
Today’s Numbers
As of fiscal year 2025, the federal deficit stands at approximately $3.57 trillion. This marks a 9.7% increase from the same period last year (October 2023–March 2024), when spending totaled $3.25 trillion. The $315 billion increase reflects continued growth in mandatory programs such as Social Security, Medicare, and Medicaid, along with rising interest payments on the national debt- all of which are outpacing federal revenue. To help bridge this fiscal shortfall, the U.S. government raises funds by issuing Treasury securities, which are sold at auction to investors around the world.

II. Short Term Sustainability: How the Government Borrows
When the U.S. government runs a deficit, it must borrow money to cover the gap between spending and revenue. This balancing act is managed by the U.S. Department of the Treasury, which raises funds by issuing debt securities known as Treasuries. These securities come in various forms: Bills (T-Bills), Notes, and Bonds, each with different maturities and interest rates.
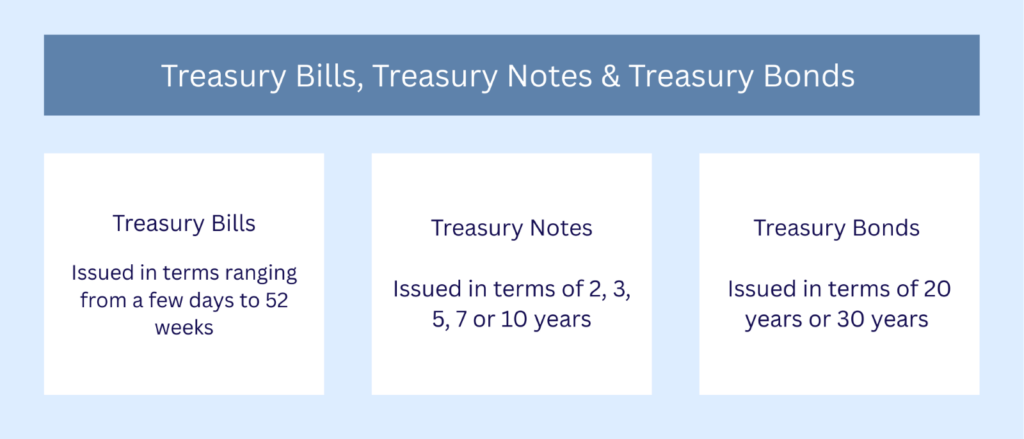
These new issues are offered through public auctions which are held throughout the year. The process involves large institutions, fund companies, foreign governments, and others- submitting bids which ultimately set interest rates based on demand. These securities are awarded to successful bidders and trade further in the secondary markets.
Historically, there has been strong and consistent demand for U.S. Treasury securities, which are backed by the “full faith and credit” of the United States (the world’s largest economy). This trust, combined with the U.S. dollar’s status as the global reserve currency, has positioned Treasuries as one of the safest and most reliable investments worldwide. Foreign governments, central banks, and global institutions routinely purchase U.S. debt not only for portfolio stability and investment income, but also to hold as reserves, reinforcing their own economic security.
III. Long Term Impact: Taxes and Interest Rates
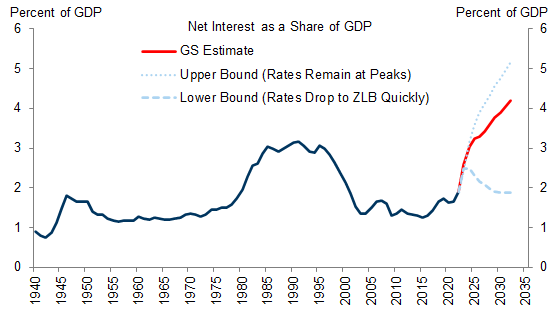
The U.S. federal budget will likely remain a pressure point in the years ahead, drawing attention from policymakers, economists, and investors. While running a fiscal deficit has become the norm in recent decades, net interest expense has remained relatively manageable when measured against the size of the U.S. economy (GDP). However, this balance is sensitive to interest rate changes. If interest rates fall, borrowing costs for the government decrease. But if rates remain elevated for longer, the cost of servicing the debt grows (see chart). Although the U.S. can continue to borrow to finance deficits, a sustained increase in Treasury issuance could impact both investor demand and overall interest rates.
To address the growing deficit, policymakers reach for two levers:
- Decreasing Government Spending
- Increasing Revenue (taxes)
Spending cuts might include program reforms, defense budgets reductions, and limitations on discretionary spending. Each carrying their own economic and social trade-offs. On the other hand, options for boosting revenue involve taxes- raising income through higher corporate, capital gains, or personal income taxes. No one path offers a complete solution and policy changes introduce new challenges and opportunities when planning for our clients. Balancing the budget is a delicate process and nothing demonstrates the complexity like the online resource Build Your Own Tax Extensions Calculator. If you want to learn more about the history, we have explored A Presidential Look at U.S. Taxes in a prior Weatherly blog post.
How WAM Can Help?
The U.S. fiscal budget is far more complex than a single headline number. While a large deficit may appear daunting, it can also present opportunities within the fixed income space. Particularly through increased Treasury issuance, which can offer attractive state and local tax-exempt yields for their investors.
Changes in tax policy tied to the deficit open the door to new strategies in estate planning and gifting. As the fiscal landscape evolves, we encourage you to reach out to your Weatherly advisory team to ensure your investment allocation, long-term goals, and financial plan remain aligned with current opportunities and challenges.
*Disclosures:* The information provided should not be interpreted as a recommendation, no aspects of your individual financial situation were considered. Always consult a financial professional before implementing any strategies derived from the information above.
Blog content is human-generated by the Weatherly team members. AI was used to assist with generating titles and subtitles.